


 18 / 46

16
Board Name
Total
Providers
Board
Approved
Providers
Statute/Rule
Approved
Providers
Received
Applications
Approved
Applications -
New provider
applications
approved
during the
7/1/13-
6/30/14 time
frame
Approved
Applications
(Received
outside
7/1/13-
6/30/14
timeframe)
Approved
New Courses -
routed to Board
for review
during the
7/1/13-6/30/14
timeframe
Approved
New Courses
- auto-
accepted
during the
7/1/13-
6/30/14
timeframe
Approved
New
Courses
Acupuncture
132
116
16
29
30
2
429
130
559
Athletic Training
66
12
54
9
8
1
3
185
188
Chiropractic Medicine
20
20
0
5
2
0
429
0
429
Clinical Laboratory
Personnel
170
163
7
11
9
0
32
3,287
3,319
Clinical Social Work,
Marriage and Family
Therapy and Mental
Health Counseling
670
550
120
53
46
10
48
5,810
5,858
Dental Laboratories
25
22
3
8
7
0
28
329
357
Dentistry
319
140
179
58
46
2
0
1,677
1,677
Dietetics and Nutrition
101
0
101
4
1
0
0
713
713
Electrolysis Council
36
19
17
13
3
0
3
55
58
Emergency Medical
Services
229
55
174
19
23
5
248
205
453
Hearing Aid Specialists
30
4
26
2
2
0
5
53
58
Massage Therapy
817
375
442
81
64
6
91
1,415
1,506
Medical Physicists
5
0
5
0
0
0
0
60
60
Medicine¹
155
0
155
27
24
2
0
7,059
7,059
Midwifery
12
1
11
5
2
0
0
17
17
Nursing
976
965
11
88
92
11
184
16,674
16,858
Nursing Home
Administrators
102
102
0
7
7
1
21
979
1,000
Occupational Therapy
211
181
30
24
23
0
37
2,213
2,250
Opticianry
21
21
0
3
4
2
17
576
593
Optometry
135
133
2
20
16
1
1,756
1
1,757
Orthotists and
Prosthetists
16
2
14
1
1
0
3
73
76
Osteopathic Medicine
102
0
102
14
14
1
0
4,220
4,220
Pharmacy
151
99
52
26
20
2
144
3,033
3,177
Physical Therapy
Practice
649
606
43
107
105
4
1,626
1,120
2,746
Physician Assistants²
101
0
101
15
14
3
0
2,429
2,429
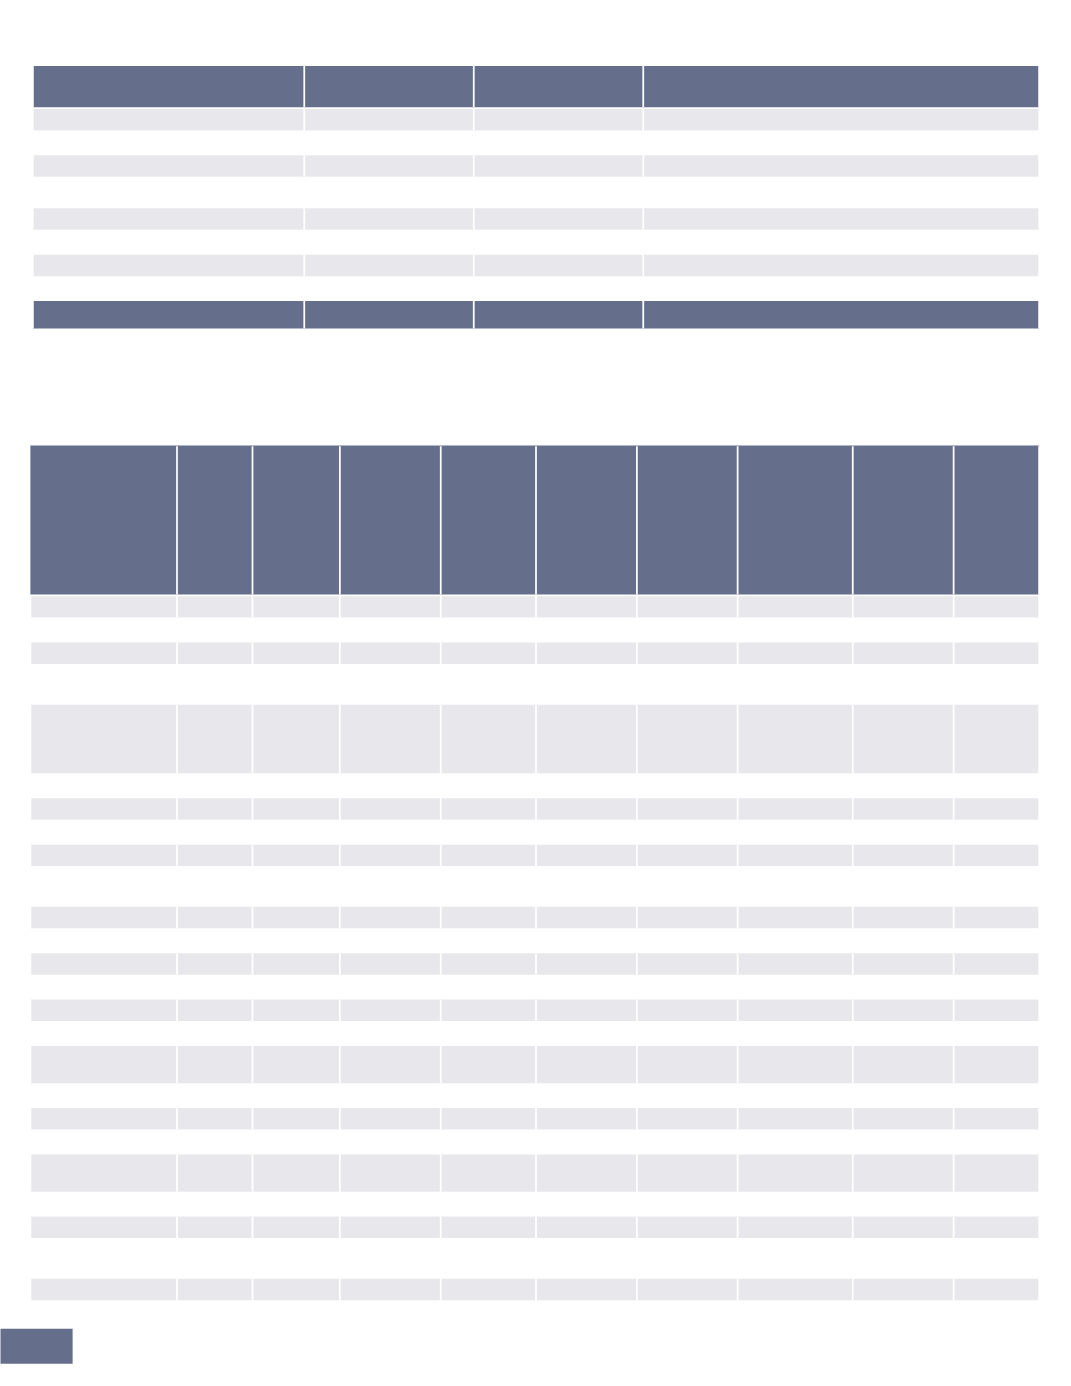
Table 3: Recognized Continuing Education (CE) Providers
Table 2: Summary of Licensed Facilities and Establishments
Definitions:
Active
-- The licensed facility is authorized to operate in the state of Florida.
Delinquent
-- The licensed facility is not authorized to operated in the state of Florida because it failed to renew its active license by the expiration date.
Establishment
Active
Delinquent
Total
Dental Laboratory
928
195
1,123
Electrolysis Facility
255
84
339
Massage Establishment
9,688
3
9,691
Office Surgery Registration
510
0
510
Optical Establishment Permit
1,389
0
1,389
Optometry Branch Office
1,050
0
1,050
Pain Management Clinic
359
0
359
Pharmacy
9,833
0
9,833
Total
24,012
282
24,294